“Big Data” was the big catchphrase in 2012-2013. As a graduate student at Newhouse I got a big taste of that. In 2013, my alma mater held a Social Commerce Day where a speaker Chuck Hemann, (then of PR firm WCG, now Manger of Analytics for Intel) came to talk to us about how research is changing to meet the new communications landscape. He mentioned the importance of analytics and mentioned a number of social media monitoring and engagement tools.
In the nearly two years since some of the examples are out of date but the primary message holds true- listen to what your audience cares about and cater to that. If you do it right, then you can connect that to business goals and convert social media followers into customers.
Having used web analytics for years to examine the effect of different online efforts businesses use, I’m even more convinced that higher ed and independent schools can learn a lot from digging into the metrics that mean the most to them.
From a perfunctory search of schools looking to improve their marketing, schools are currently looking to hire at least 87 positions for those who understand analytics, from the Marketing Manager at USF at Harvard to the Assistant Director for Web Communications at SJU (just down the street from FCS).
A quick aside- I must address somewhat humorous requirement that one of the minimum qualifications is the “Ability to articulate why ‘Click Here’ is never a thing.”
[Answer: in 2014, it’s like saying “After the beep say something and your voice will be recorded” in your voice-mail greeting (if you still use one). Not only do you risk insulting someone’s intelligence (people know what links are and how to click on them, it distracts from the user experience and requires people to think (or at least continue reading) to know what they’ll get by clicking. Tim Berners-Lee (inventor of the World Wide Web), in 1992 made the case against discussing mechanics, it has been a best practice for 14 years, and just makes your site seem out-dated. Smashing Magazine can tell you more.]
That being said, sometimes you’re limited by your CMS in terms of ways to ensure an important link is obviously a link. It’s not ideal, but in some unfortunate cases it may be the least bad option. In other cases, where your audience is accustomed to clicking “click here”, it still isn’t the ideal choice, but is understandable.
But I digress. In the same job description (and alluded to in many others) is the notion that people working in web communications not only have to be able to produce written content and collaborate with designers (vendors, developers, etc), but also need to be able mine for trends in Google Analytics that will lead to “recommendations on improvements that will help further the University’s marketing and communication objectives”. This means not simply reporting on the ‘big picture’ (we got this much traffic this month, “people like these pages”, etc) but on the multiple smaller (and more important) pictures.
So just as vanity metrics (i.e. 22% increase in Twitter followers and 440 more Facebook Likes) look nice in a report, they aren’t enough. What’s more useful is what isn’t readily available on your Facebook page or Twitter profile. It’s the ‘small’ things that matter- changing the wording of an solicitation brought in X% more donations, creating/posting X type of photos/video to platform Y led linking to page Z led to X% more qualified admission leads than did linking to a different page, and that optimizing our admission process for future families increased inquiries by y% over the same period last year.
I think independent school communicators could learn a lot and help their schools by digging deeper. I’m fortunate to work at an amazing school that created my position that (in part), is responsible for making our online presence the most effective tool it can be for advancing the school’s priorities.
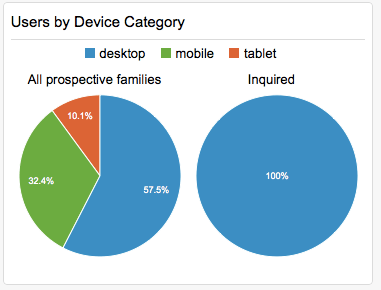
Without giving any actionable intelligence to our competitors, what I can share is a way of thinking By making a custom dashboard for inquiries and looking at Users by Device Category, (if one is familiar with the inquiry process), one could make specific recommendations.
In the graph below, (if it were useful data and not something I finagled into what I wanted for this example, given that a high percentage of our target audience accesses our site on mobile and tablet devices, and I might recommend front-end or other changes so that more prospective families complete an inquiry. Before doing so, I’d make sure to look at things like behavior flow, the mobile and tablet goal abandonment numbers/rates, and different segments (including prospective families who have already inquired) to see the whole picture (or, more accurately, the most important parts of the picture).
What I can also share is the Custom Dashboard I created and am using (in part) to measure the effectiveness and generate recommendations to further my schools goals. This isn’t proprietary information, it isn’t a silver bullet to anything problem (despite being one of 13,000+ Solutions in the GA Solutions Gallery), but for those who want to look beyond the “what is the number” to the “how did we get to this number and how to we increase it”, I think it’s a good starting spot.
I always love feedback. Please let me know if you see anything that you think would be a helpful addition or change.
Best,
Geoff

You must be logged in to post a comment.